There are many different nuclei which can be observed by NMR spectroscopy: 1H (proton), 13C (carbon 13), 15N (nitrogen 15), 19F (fluorine 19), and many others. 1H, and 13C are the used the most often. I will describe 1H because it is very representative of NMR spectroscopy.
All nuclei have a positive charge and are constantly spinning like a top. We know from physics that a charge in motion creates a magnetic field. In NMR, when we hit the nucleus with radio frequency (Rf) radiation, it causes the nucleus and its magnetic field to flip (or it makes the nuclear magnet resonate, hence the name NMR). In the NMR spectrometer there is a coil of wire which surrounds the sample. We also know from physics that a magnet moving in a wire coil causes a charge to flow in the wire. So when the magnetic field of the nucleus flips, it causes a current in the wire which the computer can detect. You can see a movie of this process below.
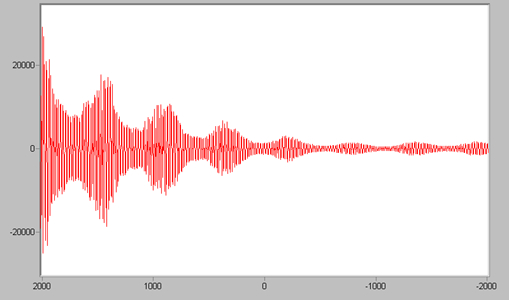
The pattern seen here is called Free Induction Decay, or FID. It looks like it does because when the nuclei are pulsed, the spins of like nuclei group together and after the pulse, the spins slowly move apart, or decay. This is visible in the FID. After the FID is transformed, it looks like this . . .
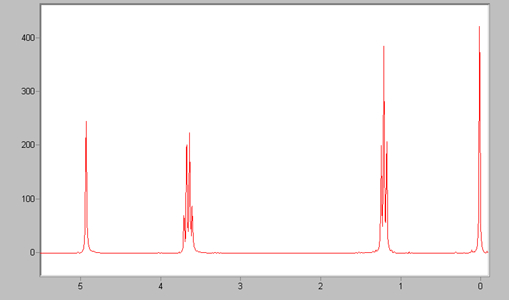
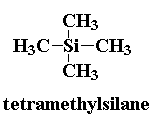
Before you can determine which peaks correspond to specific nuclei, you must set the scale for the chemical shifts of the spectrum. Chemical shift is a fancy scientific name for the position of a peak on the spectrum. In order to set the scale of the spectrum, a standard is needed. This standard is often tetramethylsilane, or TMS. You can see its structure on the right. TMS is used because it is one of the most shielded molecule (which means it appears far away from any other peaks you might see in your spectrum) plus all its protons are equivalent which makes it easier to see even when present in small quantities. Therefore, it should show up as one peak which can be used to set the 0 mark on the spectrum. This is the peak you see at 0 above.
The first thing you might notice when looking at the spectrum is that there are not just a few peaks on the spectrum, but rather some single peaks, some double peaks, and even larger groups of peaks called multiplets. These groups of peaks are each due to one type of nuclei, not many as one might assume. The reason there are a group of peaks instead of just one is that hydrogens on one carbon are coupled to, or interact with the magnetic fields of hydrogens on adjacent nuclei. This coupling "splits" the signal into the multiple peaks seen in the spectrum. This splitting follows what is known as the "N plus one rule," which states that the number of peaks seen for each type of hydrogen is equal to the number of hydrogens on adjacent nuclei (N) plus one.
For example, the spectrum above is of ethyl alcohol, the structure of which is H3C-CH2-OH. The peak between 1 and 2 corresponds to the hydrogens on the CH3 group. It is split into three peaks by the hydrogens on the CH2 group (2+1=3). The peak between 3 and 4 is the peak for the hydrogens on the CH2 group. It is split into four peaks by the hydrogens on the CH3 group (3+1=4).
Below is a table of just a few of the many different chemical shifts possible in 1H NMR (given in parts per million, or ppm) and the protons associated with those shifts, which are highlighted in red.
| proton | chemical shift (ppm) | ||
| ethane (H3C-CH3) | 1.25 | ||
| propane (H3C-CH2-CH3) | 1.17 | ||
| cyclopropane (C3H6) | 0.22 | ||
| cyclopentane (C5H10) | 1.40 | ||
| cyclohexane (C6H12) | 1.35 | ||
| toluene (H3C-C6H5) | 2.87 | ||
| styrene (H2C=CH-C6H5) | 5.09 | ||
| styrene (H2C=CH-C6H5) | 6.68 | ||
| Aromatics | ortho | meta | para |
| benzene (C6H6) | 7.54 | 7.54 | 7.54 |
| toluene (H3C-C6H5) | 7.16 | 7.16 | 7.16 |
| styrene (H2C=CH-C6H5) | 7.24 | 7.24 | 7.24 |
| bromobenzene (Br-C6H5) | 7.49 | 7.14 | 7.24 |
| phenol (HO-C6H5) | 6.77 | 7.13 | 6.87 |
Chemical Shift Tables
And now for those of you with an unquenchable thirst for more data on chemical shifts, we offer two tables rich with quenching information. Most of the entries are solvents that might be contaminants in your reaction products or used for NMR analysis. The first lists the proton (1H) chemical shifts of dozens of small molecules. The second lists corresponding carbon (13C) data for the same molecules. The shifts are given for several common NMR solvents so you can see how your choice of NMR solvent can effect where the peaks in your spectra show up.And Collections of Spectra
Not satisfied with just tables of spectral data? You want to see real spectra? Well, have we got a deal for you (free, that is, to good home): go here to see spectral collections of various kinds, from proton to carbon, solution to solid state, and even including some nitrogen, silicon and deuterium spectra. "Wow!" you say in absolute amazement. Well, hold onto whatever horses you have because here's the bad news: it's a work in progress, and some of the spectra are just photocopies that may be off a little. But hey, they're all free and free to download, so bear with us as we add more and more of all kinds of spectra of solvents, small molecules, monomers and polymers.
|
|
Return to Level Five Directory |
|
|
Return to Macrogalleria Directory |