There are many different nuclei which can be observed by NMR spectroscopy: 1H (proton), 13C (carbon 13), 15N (nitrogen 15), 19F (fluorine 19), and many others. 1H, and 13C are the used the most often. I will describe 1H because it is very representative of NMR spectroscopy.
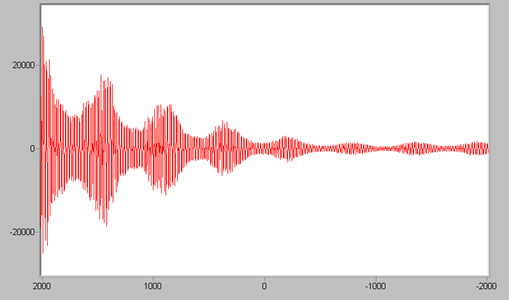
All nuclei have a positive charge and are constantly spinning like a top. We know from physics that a charge in motion creates a magnetic field. In NMR, when we hit the nucleus with radio frequency (Rf) radiation, it causes the nucleus and its magnetic field to flip (or it makes the nuclear magnet resonate, hence the name NMR). In the NMR spectrometer there is a coil of wire which surrounds the sample. We also know from physics that a magnet moving in a wire coil causes a charge to flow in the wire. So when the magnetic field of the nucleus flips, it causes a current in the wire which the computer can detect. You can see a movie of this process below.
 Before you can determine which peaks correspond to specific nuclei, you
must set the scale for the chemical shifts of the spectrum. Chemical
shift is a fancy scientific name for the position of a peak on the
spectrum. In order to set the scale of the spectrum,
a standard is needed. This standard is often tetramethylsilane, or TMS.
You can see its structure on the right. TMS is used because it is the
most shielded molecule and all its protons are equivalent. Therefore, it
should show up as one peak which can be used to set the 0 mark on the
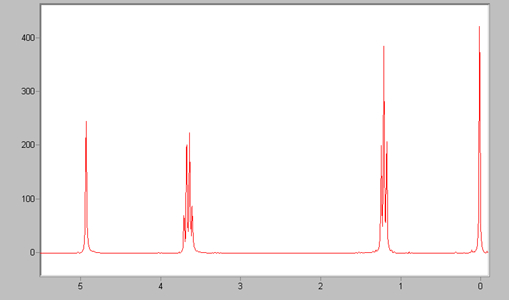
spectrum. This is the peak you see at 0 above.
Before you can determine which peaks correspond to specific nuclei, you
must set the scale for the chemical shifts of the spectrum. Chemical
shift is a fancy scientific name for the position of a peak on the
spectrum. In order to set the scale of the spectrum,
a standard is needed. This standard is often tetramethylsilane, or TMS.
You can see its structure on the right. TMS is used because it is the
most shielded molecule and all its protons are equivalent. Therefore, it
should show up as one peak which can be used to set the 0 mark on the
spectrum. This is the peak you see at 0 above.The first thing you might notice when looking at the spectrum is that there are not just a few peaks on the spectrum, but rather some single peaks, some double peaks, and even larger groups of peaks. These groups of peaks are each due to one type of nuclei, not many as one might assume. The reason there are a group of peaks instead of just one is that hydrogens on one carbon are coupled to, or influenced by the magnetic fields of hydrogens on adjacent nuclei. This coupling "splits" the signal into the multiple peaks seen in the spectrum. This splitting follows what is know as the "N plus one rule," which states that the number of peaks seen for each type of hydrogen is equal to the number of hydrogens on adjacent nuclei (N) plus one. For example, the spectrum above is of ethyl alcohol, the structure of which is H3C-CH2-OH. The peak between 1 and 2 corresponds to the hydrogens on the CH3 group. It is split into three peaks by the hydrogens on the CH2 group (2+1=3). The peak between 3 and 4 is the peak for the hydrogens on the CH2 group. It is split into four peaks by the hydrogens on the CH3 group (3+1=4).
Below is a table of just a few of the many different chemical shifts (given in parts per million, or ppm) possible in 1H NMR and the protons associated with those shifts, which are highlighted in red.
| proton | chemical shift (ppm) | ||
| ethane (H3C-CH3) | 1.25 | ||
| propane (H3C-CH2-CH3) | 1.17 | ||
| cyclopropane (C3H6) | 0.22 | ||
| cyclopentane (C5H10) | 1.40 | ||
| cyclohexane (C6H12) | 1.35 | ||
| toluene (H3C-C6H5) | 2.87 | ||
| styrene (H2C=CH-C6H5) | 5.09 | ||
| styrene (H2C=CH-C6H5) | 6.68 | ||
| Aromatics | ortho | meta | para |
| benzene (C6H6) | 7.54 | 7.54 | 7.54 |
| toluene (H3C-C6H5) | 7.16 | 7.16 | 7.16 |
| styrene (H2C=CH-C6H5) | 7.24 | 7.24 | 7.24 |
| bromobenzene (Br-C6H5) | 7.49 | 7.14 | 7.24 |
| phenol (HO-C6H5) | 6.77 | 7.13 | 6.87 |
 Return to the Nuclear Magnetic Resonance Spectroscopy PageReturn to
Macrogalleria Directory
Return to the Nuclear Magnetic Resonance Spectroscopy PageReturn to
Macrogalleria Directory